T.V. poll
We wanted to know if there were differences in T.V. habits
in boy's and girl's in the 5th grade. We handed out a poll and we
put the results on a spread sheet then we calculated some statistics.
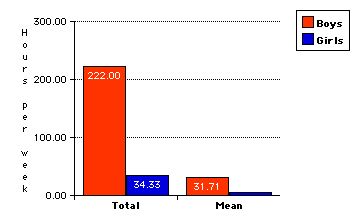
We calculated the total, the minimum, maximum, and the mean (the mean is
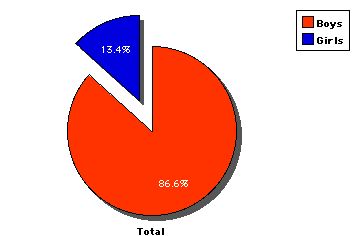
the average number). We did a bar graph and a pie chart. The
charts show the totals and the means. The girl's mean is so
low it does not show. The girl's mean was 4.90. The girl's
watch much less T.V. during the week.
|
 |